International Journal of Scientific & Engineering Research, Volume 6, Issue 2, February-2015 844
ISSN 2229-5518
A Survey on Benchmark Defects Encountered in the Oil Pipe Industries
Wissam Alobaidi, Eric Sandgren, Hussain Al-Rizzo
Abstract— Oil and natural gas have been transported by pipeline for over a century, yielding a large amount of information about defects in manufacture and in service. Research has moved toward early detection of defects in the body and welds of pipe during the manufacturing process. The most common defects occur in the welds, and can be categorized into 7 basic types: porosities, slag inclusions, lack of fusion, lack of penetration, cracks, burn-through and irregular shapes. Any of these may occur in the five most common welding configurations used in manufacturing. The five common joint types are: butt-weld joint, tee-weld joint, corner-weld joint, lap-weld joint and edge-weld joint. The purpose is to aid in the elimination of problems in the manufacturing process that lead to manufacturing defects, thus enhancing product quality. The relationship between defect type and the Non- destructive testing (NDT) methods which best detect each type, are summarized in tabular form. The table also relates the location of the defect (whether surface or subsurface, or both) to the NDT techniques. Illustrations of each type of defect are presented for reference. The relationship of defect type and location to cost and labor needed to detect each type, is presented in graphic form. The surface defects are easily detected with Visual Inspection, while subsurface defects can be caught with Radiographic Testing when conducted at the recommended speed of 50mm/s, but if they are missed they can be detected with Ultrasonic Testing, which is more labor-intensive, and which must be verified with a second NDT technique, Digital X-ray Testing. To enhance production efficiency, and the series of NDT stations needed for oil and natural gas pipeline manufacturing, we must determine how to incorporate new techniques to cover the shortcomings of present methods of detecting defects. This will reduce labor time and increase throughput while maintaining the quality of the finished product.
Index Terms— Oil Pipeline, Natural Gas Pipeline, Pipe defect, Pipe Inspection, Weld Discontinuity, Weld Flaw Detection, Metal pipe, Weld
Position, Pipe Components, Ultrasonic Testing, Radiography Testing, Digital X-Ray Testing, Visual Inspection, Non-Destructive Testing.
—————————— ——————————
1 INTRODUCTION
HE most effective system for transferring oil and gas for great distances is the pipeline. The existing pipeline infrastructure is aging, which causes a great deal of concern over the remaining useful life of current pipelines. In order to protect both the environment and the population of areas served by these pipelines, it has become increasingly important to devise ways to monitor the integrity of these structures. Operators are concerned about monitoring leaks, and detecting potential faults in older sections of the pipeline system [1]. Oil and natural gas have been transported by pipeline since the early 20th century. With over a century of experience with the technology, the industry has kept careful records of bad outcomes due to weld and material failures. In addition to endangering public safety and the environment, pipeline failures can lead to personal injury. Records show that there were four incidents of injury due to failure of pipeline material or welds in the years between 1996 and 2003
[2].
Non-destructive evaluation (NDE) for locating and identifying discontinuities in the pipes themselves during both manufacturing and while in service, represents an effective methodology for insuring the integrity of the current network [3-16]. Ultrasonic, angle beam probe an example for exams the section of pipe body as illustrated in fig. 1.
____________________________________
Wissam Alobaidi, Corresponding Author, PhD Candidate, Engineering Science and Systems, Mechanical and Materials Engineering, University of Arkansas at Little Rock, USA, E-Mail: wmalobaidi@ualr.edu
Erick Sandgren, Professor, Engineering Science and Systems, Mechanical and Materials Engineering, University of Arkansas at Little Rock, USA, E-mail: exsandgren@ualr.edu
Hussain Al-Rizzo, Professor, Engineering Science and Systems, Telecommu- nications and Networking Engineering, University of Arkansas at Little Rock, USA, E-mail: hmalrizzo@ualr.edu
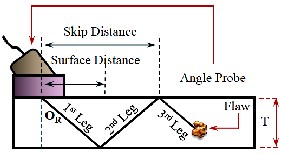
Figure 1. Schematic of the ultrasonic angle beam probe in use for pipeline.
Where θR is the angle of wave reflection, T is the thickness of the pipe, 1st leg, 2nd leg, and 3rd leg show the configuration of the sound paths. Note that flaws in the pipe body are usually laminations or inclusions [17], as shown in fig. 1.
Over the century since oil and natural gas pipeline was first introduced there has been great improvement in the methods used for manufacture and welding. Today’s steel contains fewer impure inclusions, and welding is a more exact process [2],[18]. Pipe is tested under pressure by the manufacturer
before it leaves the factory. New welds are assessed with NDE
IJSER © 2015 http://www.ijser.org
International Journal of Scientific & Engineering Research, Volume 6, Issue 2, February-2015 845
ISSN 2229-5518
to be certain that they are discontinuity-free. Well-established and tested standards are necessary during the manufacture of pipe in order to insure the continued integrity of the pipeline network into the future [18]. Government bureaus, stakeholders, and landowners demand that the installed pipelines are as free of defects as realistically possible [1],[2],[18]. Pipe sections must be transported from the factory to the field. Despite the care taken during manufacture and installation, repeated flexing of pipe sections during transport can sometimes cause cracks in the wall of the pipe. This transit fatigue cracking is normally revealed when the installed pipeline is pressure tested before being put into service. Still, some transit fatigue goes undetected by this pre-service testing, and can worsen while the pipe is repeatedly pressurized during normal operation. Eventually, these undiscovered discontinuities can lead to failure [2]. Due to the nature of materials, some pipe sections will develop larger discontinuities during their service life. Such a section must be individually tested for structural integrity, and an assessment must be made concerning its continued fitness for service. A growing arsenal of testing methods has been developed over the past several decades for accurately determining the magnitude of such discontinuities [18].
Recently, research has moved toward early detection of defects in the body and welded areas of pipeline during manufacture. Much of the research is focused on detecting reduction defects in pipe wall thickness, and coordinating this detection with existing NDE technologies.
The lack of information about other types of defects which can occur during the manufacture of oil and natural gas pipelines has motivated us to survey the range of surface and subsurface discontinuities, and to present the information in one place. Most of the information presented here relied on technical websites as the source. Some of the information comes from the author’s personal experience working in pipe manufacture.
With all this information assembled into one paper it is easier
for researchers to take advantage of the untapped areas of study, and to find solutions to the various problems that are available in this field. Moreover, in this paper, we present a thorough overview of the types of weld joint discontinuities and their positions relative to the weld. The paper presents the full range of weld and body discontinuities that may occur during manufacture both before forming of the pipe, and after forming. We also discus discontinuities that may form within the weld itself.
Our main purpose is to highlight all the potential defects that
may occur during manufacturing, and give a wide space for research into ways to reduce these defects through the further
development of existing NDE technologies available to the
pipe manufacturing plant.
2 REVIEW OF WELD JOINT TYPES
Welding is the practice of joining components by using melting of a filler material to fuse the constituent parts together [19]. There are five basic types of joints used in welding:
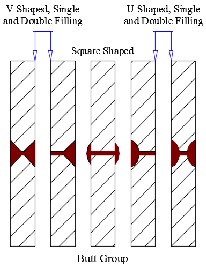
First, the butt weld joint. This is the way pipes are made. The pieces are of equal thickness, and joined at the edge by V-shaped double and single filling, U-shaped double and single filling, and square filled joints, as shown in fig. 2, [20],[21].
Figure 2. Diagram of five butt weld filling types.
Second, the tee weld joint. Tee joints are made with pieces intersecting at a 90° angle, with the joint occurring in the middle of one part of the structure. The joints are bevel- shaped, single or double filling, J-shaped single or double filling, and square filled joints, as shown in fig. 3, [20],[21].
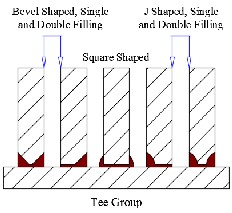
Figure 3. Diagram of five tee weld filling types.
IJSER © 2015 http://www.ijser.org
International Journal of Scientific & Engineering Research, Volume 6, Issue 2, February-2015 846
ISSN 2229-5518
Third, the corner weld joint. Corners are formed using the corner weld, another joint whose components are joined at a
90° angle. The weld is located on the outside edge, and may
use V-shaped single or double filling, U-shaped single or double filling, or square filled joints, as shown in fig. 4, [20], [21].
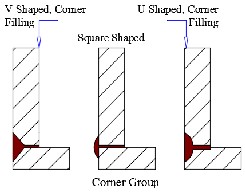
Figure 4. Diagram of three corner weld filling types.
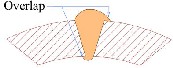
Forth, lap weld joint. To create the lap weld, one piece is placed so that one overlaps the other for a specific distance. They are joined at the parallel interface. The bead can be run down one side only, or on both sides of the overlap, as shown in fig. 5, [20], [21].
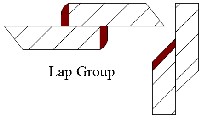
Figure 5. Diagram of lap weld filling.
Fifth, edge weld joint. The edge weld is another type of weld where the components are parallel at the weld. Two sheets are placed together, and the bead is placed along the aligned edges of the parts. This can be used to join a J-shaped piece to a flat sheet or two flat sheets, as shown in fig. 6, [20], [21].
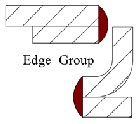
Figure 6. Diagram of edge weld filling.
3 DEFECTS
The steel manufacturing process can leave impurities in the finished steel. These inclusions can cause the crystalline structure of the steel to be bonded in a weaker state, resulting in discontinuities. More modern steel-making techniques have greatly reduced the likelihood of inclusions, creating much higher quality steel. Yet, even the lower incidence of inclusions can still lead to failure [2]. Fig. 7 shows the ideal formation of a welding bead, in pipe cross-section.
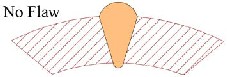
Figure 7. Cross section of ideal contour for welding bead for oil and natural gas pipeline.
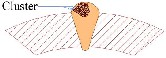
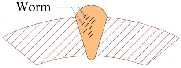
3.1 Porosity
Porosity defects come from gas bubbles trapped in the metal filler as it solidifies. There are many sources of these bubbles in the welding process, but porosity can most often be avoided if the work pieces are completely cleaned before welding. Porosity can also be reduced if the welding current is kept below excessive levels. Faster manufacturing speeds are more likely to generate porosity defects [17], [22].
Three common types of porosity defects are shown in fig. 8.
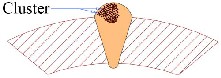
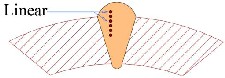
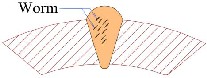
Figure 8. Cross-sectional illustration of cluster, linear and worm porosity discontinuities in pipeline weld.
IJSER © 2015 http://www.ijser.org
International Journal of Scientific & Engineering Research, Volume 6, Issue 2, February-2015 847
ISSN 2229-5518
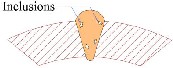
3.2 Inclusions
Non-metallic substances stuck within the weld metal, or between the bead and the base are called slag inclusions [17], [22], as shown in fig. 9.
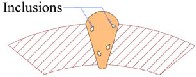
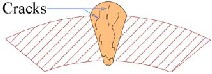
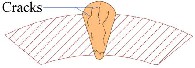
Figure 12. Cross sectional illustration of crack-type discontinuities in pipeline weld.
Figure 9. Cross sectional illustration of slag inclusions in pipeline weld.
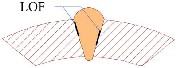
3.3 Lack of Fusion (LOF)
Contaminated surfaces can lead to lack of fusion (LOF) defects in welds. The name explains how the defect occurs, the welding bead fails to adhere to, to fuse with, the base metal, leaving a weak joint [17], [22], as shown in fig. 10.
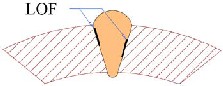
Figure 10. Cross sectional illustration of LOF discontinuity in pipeline weld.
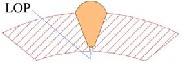
3.4 Lack of Penetration (LOP)
Lack of penetration (LOP) describes the type of defect where the weld metal does not fully fill the joint. The fill is smaller than it should be, leading to a stress point that can easily give rise to a crack [17], [22], as shown in fig. 11.
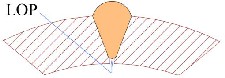
Figure 11. Cross sectional illustration of LOP discontinuity in pipeline weld.
3.5 Cracks
If the weld metal shrinks as it solidifies, cracks may develop within the bead. This weakens the weld, because the weld metal is no longer continuous [17], [22], as shown in fig. 12.
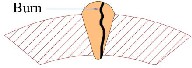
3.6 Burn-Through
A burn-through defect happens due to excessive heat which actually burns the weld metal, often creating globs of metal on the back side of the weld [17], as shown in fig. 13.
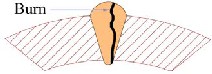
Figure 13. Cross sectional illustration of burn-through discontinuity in pipeline weld.
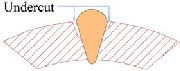
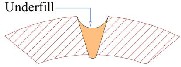
3.7 Irregular Shapes
Any difference from the ideal contour of the weld bead is called an irregular shape defect. Each type of irregular shape has its particular cause, but they all result in stress-sensitive joints that are subject to early failure [17], [22]. The various types of irregular shape defects are shown in fig. 14.
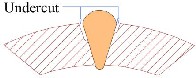
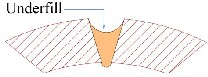
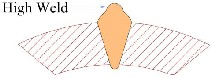
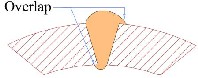
Figure 14. Cross sectional illustration of undercut, underfill, high weld and overlap defects in pipeline welds.
IJSER © 2015 http://www.ijser.org
International Journal of Scientific & Engineering Research, Volume 6, Issue 2, February-2015 848
ISSN 2229-5518
4 SUMMARY OF SURVEY
An overview of the characteristics of benchmark defects, and corresponding NDT detection techniques used in oil pipe manufacturing is shown in table 1 below.
Table 1: Summary of benchmark defects and NDT detection techniques used in the oil pipe industry.
Pipe Section shape | Defect Typ | Surface | Sub-Surface | NDT Techniques | |
Defects including in the weld only | Defect Typ | Surface | Sub-Surface | NDT Techniques | |

| Cluster Porosity | | | UT | Strongly Detectable |
| Cluster Porosity | | | RT | Detectable |

| Cluster Porosity | | | DXR | |

| Linear Porosity | | | UT | Strongly Detectable |

| Linear Porosity | | | RT | Detectable |

| Linear Porosity | | | DXR | |

| Worm Porosity | | | UT | Strongly Detectable |
| Worm Porosity | | | RT | Detectable |

| Worm Porosity | | | DXR | |

| Slag | | | UT | Strongly Detectable |
| Slag | | | RT | Detectable |

| Slag | | | DXR | |

| Lack of fusion | | | UT | Strongly Detectable |
| Lack of fusion | | | RT | Weakly Detectable |

| Lack of fusion | | | DXR | |

| Lack of penetration | | | UT | Strongly Detectable |
| Lack of penetration | | | RT | Weakly Detectable |

| Lack of penetration | | | DXR | |
IJSER © 2015 http://www.ijser.org
International Journal of Scientific & Engineering Research, Volume 6, Issue 2, February-2015 849
ISSN 2229-5518
| Crack | | | UT | Strongly Detectable |

| Crack | | | RT | Detectable |

| Crack | | | DXR | |

| Burn Through | | | VI | Strongly Detectable |
| Burn Through | | | RT | Strongly Detectable |

| Burn Through | | | |

| Undercut | | | VI | Strongly Detectable |
| Undercut | | | RT | Strongly Detectable |

| Undercut | | | |

| Underfill | | | VI | Strongly Detectable |
| Underfill | | | RT | Strongly Detectable |

| Underfill | | | |

| High Weld | | | VI | Strongly Detectable |

| High Weld | | | |

| Overlap | | | VI | Strongly Detectable |
| Overlap | | | |
The NDT methods used for quality assurance testing in pipe manufacturing. Ultrasonic Testing (UT), Radiography Testing (RT), Digital X-Ray Testing (DXR), Electromagnetic Testing (ET), Magnetic Particle Testing (MPT) and Visual Inspection (VI) are common NDT techniques used in the manufacture of pipes.
Defects considered in the survey are summarized in Table 1 above. The purple color means that the defect may appear on the surface, the yellow means that the defect may appear sub-surface. Note that most of the defects have both colors in the table, meaning that they can appear in either position, although the example cross-sectional illustrations show only one type or the other. The green color indicates the necessity of verifying the detection of a particular type of defect by UT, with a secondary
DXR inspection.
IJSER © 2015 http://www.ijser.org
International Journal of Scientific & Engineering Research, Volume 6, Issue 2, February-2015 850
ISSN 2229-5518
5 DISCUSSION
Researchers, mechanical and industrial engineers, and those who are responsible for the design, or who must investigate a problem with pipeline manufacturing processes often consult websites such as the American Society of Mechanical Engineers (ASME), American Society for Nondestructive Testing (ASNT), NDT Resource Center, American Petroleum Institute (API) and other technical sites, when investigating a problem, or referencing a source. These standard references help them adapt a design to satisfy the customer’s needs, to learn the solution for a specific problem, or to develop a process. On the other hand, these organizations have a lot of information about many different pipeline components and standard processes. This paper gathers information in two important areas: first, the five most-common welding configurations used in the industry, and second, the most-commonly found defects in the manufacturing of oil and natural gas pipes. The purpose is to aid in the elimination of problems in the manufacturing process that lead to manufacturing defects, thus enhancing product quality.
It should be noted that the Summary of the survey, which
appears in Table 1, shows us the wide range of defect types that appear in the welds used during pipe manufacture. Many of these defects can occur as a surface defect, or a sub-surface one, notably, the porosities, cracks and inclusions. Conversely, the remaining types of defects, such as undercut, underfill, overlap, high weld, concavity and burn-through only appear as surface defects.
Most of the surface defects are caught by VI, but the ability to detect defects in this way is dependent on the size of the defect; some are too small to see. The smaller defects may be revealed by RT, but this still commonly depends on the size of the defect. The way of testing the pipe in RT stations is forward, helical movement with the speed being the same as production speed, which depends on the customer’s needs, in the author’s experience. The commonly recommended speed is 50mm/s, which presents a good opportunity for catching smaller defects with RT. But many times production speed is used, in which case the RT station will miss smaller defects (for example, due to an eye blink as the defect passes on the monitor screen).
For this reason, the summary Table above is based on the
recommended speed of 50mm/s [23]. If it is classified as “strongly detectable,” just “detectable,” or just “verification” in the table, as is the case with DXR, the UT station will need a lot of labor, which is proportional to the time needed to detect
the flaws, and then verify using DXR.
When we design a new way to build pipes, new problems are created in either the body of the pipe or in the weld. So we need to follow up the new design with research into possible defects that may arise in the modified manufacturing process, as well as determining NDT techniques best for detection of these defects, in order to ensure safety and long life for the products and to keep the environment safe.
6 CONCLUSION
◊ The six most common methods (VI, UT, RT, ET, MPT and DXR) of NDT technology are extensively applied in the oil pipe industries. Although these techniques are not profitable to use for small diameter pipes, 254 mm to 762 mm, because they require too much time and labor for these smaller pipes. Subsurface defects are first detected by UT and subsequently verified with DXR.
◊ V, U and square shaped welds are used in the oil pipe industries.
◊ Most pipe defects occur as a result of welding operations.
◊ Before the welding operation, the surface of the test object should be totally clean (free from any substance that prevents fusion in the welding process, like rust and grease, etc).
◊ Burn through defects in the weld if not detected before the hydraulic system test, will cause significant delay in production.
◊ Burn through, LOP, underfill and undercut defects if not detected during manufacturing, shorten the life of the pipeline, and they are most likely to cause future leakage in the pipe while in service. But burn through, if it occurs during pipe installation in the field causes immediate leakage, if it is not detected.
◊ Multiple cracks will cause weakness in the structure
of the weld.
IJSER © 2015 http://www.ijser.org
International Journal of Scientific & Engineering Research, Volume 6, Issue 2, February-2015 851
ISSN 2229-5518
Fig. 15 shows the relationship between the defect and its location, whether surface or subsurface. The line represents the relative cost and labor involved in detecting the defect type, showing that subsurface discontinuities are much more intensive in both cost and time, when compared to surface defects.
Because the detection of surface defects takes time, it should be greater than zero on the Y axis, and most surface defects are
detected by VI. Subsurface defects require much more time to detect. They are usually detectable by RT at the recommended speed; otherwise they must be caught by UT, and verified by DXR.
Cost & Labor Time For SubSurface Up
Cost & Labor Time For Surface Down
SubSurface
Surface
0
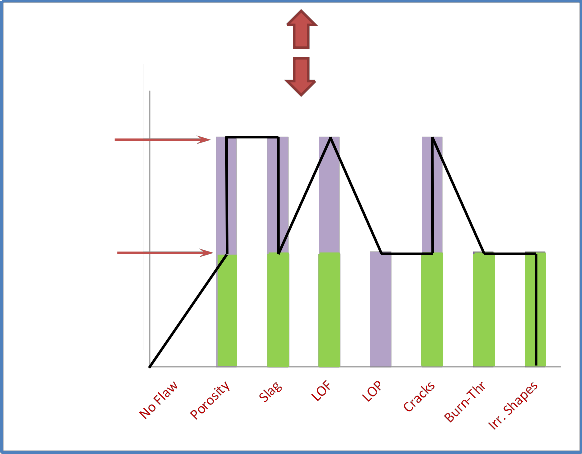
Figure 15. Relationship between surface and subsurface defects and the amount of labor and time
necessary for detection, by type of defect.
IJSER © 2015 http://www.ijser.org
International Journal of Scientific & Engineering Research, Volume 6, Issue 2, February-2015 852
ISSN 2229-5518
7 REFERENCE
[1] A. A. Carvalho, J. M. A. Rebello, L. V. S. Sagrilo, C.
S. Camerini, and I. V. J. Miranda, “MFL Signals and Artificial Neural Networks Applied to Detection and Classification of Pipe Weld Defects,” NDT E Int., vol. 39, pp. 661–667, 2006.
[2] “U.S. Department of Transportation / Pipeline & Hazardous Materials Safety Administration.” [Online]. Available: http://primis.phmsa.dot.gov/comm/FactSheets/F SMaterialWeldFailure.htm. [Accessed: 02-Feb-2015].
[3] J. Kollar and K. Lager, “Nondestructive Optical Technique for Electrically Testing Insulated-Gate Integrated Circuits,” Electron. Lett., vol. 7, no. 15, pp.
432–433, 1971.
[4] J. R. Wait, “Review of Electromagnetic Methods in Nondestructive Testing,” Proc. IEEE, vol. 67, no. 6, pp. 892–903, 1979.
[5] H. Hoshikawa, H. Saiton, J. Koido, and Y. Ishibashi, “Energy Flow in Remote Field Eddy Current Nondestructive Testing,” IEEE Trans. Magnetcs, vol.
26, no. 2, pp. 885–888, 1990.
[6] X. W. Dai, R. Ludwig, and R. Palanisamy, “Numerical Simulation of Pulsed Eddy-Current Nondestructive Testing Phenomena,” IEEE Trans. Magn., vol. 26, no. 6, pp. 3089–3096, 1990.
[7] O. Michelsson and F. H. Uhlmann, “On the Use of the 3D H-&-Formulation for the Forward Solution for Eddy Current Nondestructive Testing,” IEEE Trans. Magn., vol. 34, no. 5, pp. 2672–2675, 1998.
[8] R. V. Sabariego and P. Dular, “A Perturbation Approach for the Modeling of Eddy Current Nondestructive Testing Problems With Differential Probes,” IEEE Trans. Magn., vol. 43, no. 4, pp. 1289–
1292, 2007.
[9] S. Caorsi, A. Massa, and M. Pastorino, “A Crack Identification Microwave Procedure Based on a Genetic Algorithm for Nondestructive Testing,” IEEE Trans. Antennas Propag., vol. 49, no. 12, pp.
1812–1820, 2001.
[10] E. Kerbrat, C. Prada, D. Cassereau, and M. Fink, “Ultrasonic Nondestructive Testing of Scattering Media Using the Decomposition of the Time- Reversal Operator,” IEEE Trans. Ultrason. Ferroelectr. Freq. Control, vol. 49, no. 8, pp. 1103–1113, 2002.
[11] J. R. Claycomb, A. Brazdeikis, M. Le, R. A.
Yarbrough, G. Gogoshin, and J. H. Miller, “Nondestructive Testing of PEM Fuel Cells,” IEEE Trans. Appl. Supercond., vol. 13, no. 2, pp. 211–214,
2003.
[12] A. Bernieri, G. Betta, L. Ferrigno, and M. Laracca, “A Biaxial Probe for Nondestructive Testing on Conductive Materials,” IEEE Trans. Instrum. Meas., vol. 53, no. 3, pp. 678–684, 2004.
[13] D. Vasić, V. Bilas, and D. Ambruš, “Pulsed Eddy- Current Nondestructive Testing of Ferromagnetic Tubes,” IEEE Trans. Instrum. Meas., vol. 53, no. 4, pp. 1289–1294, 2004.
[14] H.-C. Wu, N. Gupta, and P. S. Mylavarapu, “Blind Multiridge Detection for Automatic Nondestructive Testing Using Ultrasonic Signals,” IEEE Trans. Ultrason. Ferroelectr. Freq. Control, vol. 53, no. 10, pp.
1902–1911, 2006.
[15] N. N. Qaddoumi, W. M. Saleh, and M. Abou- Khousa, “Innovative Near-Field Microwave Nondestructive Testing of Corroded Metallic Structures Utilizing Open-Ended Rectangular Waveguide Probes,” IEEE Trans. Instrum. Meas., vol.
56, no. 5, pp. 1961–1966, 2007.
[16] Q. Huang, Y. Wu, J. Baruch, P. Jiang, and Y. Peng, “A Template Model for Defect Simulation for Evaluating Nondestructive Testing in X- Radiography,” IEEE Trans. Syst. Man, Cybern. ASystems Humans, vol. 39, no. 2, pp. 466–475, 2009.
[17] “Radiograph Interpretation - Welds.” [Online].
Available: https://www.nde- ed.org/EducationResources/CommunityCollege/R adiography/TechCalibrations/RadiographInterp.ht m. [Accessed: 02-Feb-2015].
[18] A. Cosham and P. Hopkins, “The Effect of Dents in Pipelines-Guidance in the Pipeline Defect Assessment Manual,” Int. J. Press. Vessel. Pip., vol.
81, pp. 127–139, 2004.
[19] “OLYMPUS.” [Online]. Available:
http://www.olympus-ims.com/en/ndt-tutorials
/flaw-detection/weld-overview/. [Accessed: 02-
Feb-2015].
[20] “ATELIERS B.G.INC.” [Online]. Available: http://www.ateliersbg.com/news/the-5-types-of- basic-welding-joints.aspx. [Accessed: 02-Feb-2015].
IJSER © 2015 http://www.ijser.org
International Journal of Scientific & Engineering Research, Volume 6, Issue 2, February-2015 853
ISSN 2229-5518
[21] “IHS Engineering 360.” [Online]. Available: http://www.globalspec.com/learnmore/manufact uring_process_equipment/welding_equipment_su pplies/welding_brazing_soldering_equipment. [Accessed: 02-Feb-2015].
[22] “Welding Defects.” [Online]. Available: http://nptel.ac.in/courses/112107144/welding/lec ture13.htm. [Accessed: 02-Feb-2015].
[23] R. Drai, A. Benchaala, M. Zergoug, A. Badidi Bouda, Y. Kabir, and J. Hadj Djilani, Development of protocols for corrosion and deposits evaluation in pipes by radiography, no. April. 2005, pp. 1–33.
IJSER © 2015 http://www.ijser.org