In the present project, we measured R-R intervals by simple technique, and used for evaluation of Cardiac Electrophysiology, ANS profile etc.
International Journal of Scientific & Engineering Research, Volume 5, Issue 1, January-2014 214
ISSN 2229-5518
A Simple and User friendly tool for determining R-R intervals from the time series data of Electrocardiogram
Abhilash Sengupta, Soma Roy, Arnab Sengupta
—————————— ————————
In day to day practice, medical professionals used to interpret the results of various electrophysiological evaluations (like ECG, EEG, EMG etc.) in a descriptive and subjective manner. Doctors interpret the results based upon their individual skill, competence and experience. In this system, there is little scope of objective evaluation of various patterns and features remaining within the results.
Although the existing system as mentioned continues,
development in the technique of instrumentation for last two
decades enables acquisition of physiological signal in digital format. Availability of high frequency analogue to digital converters, provide detail time series data of these signals. Many new parameters of evaluation of physiological functions have been developed; out of which Heart Rate Variability (HRV), remains the most popular [1].
Heart rate (HR) is a non-stationary signal and it varies continuously in health and in disease. The pattern alteration in its variation may contain indicators of current disease, or warnings about impending cardiac diseases. The indicators may be present at all times or may occur at random - during certain intervals of the day. It is strenuous and time consuming to study and pinpoint abnormalities in voluminous data collected over several hours. Hence, HR variation analysis (instantaneous HR against time axis) has
become a popular noninvasive tool for assessing the activities of the autonomic nervous system.
Heart rate variability (HRV), the variation over time
of the period between consecutive heartbeats, is
predominantly dependent on the extrinsic regulation of the
heart rate. It is a reliable reflection of the many physiological
factors modulating the normal rhythm of the heart. In fact, they provide a powerful means of observing the interplay between the sympathetic and parasympathetic nervous systems. It shows that the structure generating the signal is not only simply linear, but also involves nonlinear contributions. HRV is thought to reflect the heart’s ability to adapt to changing circumstances by detecting and quickly responding to unpredictable stimuli. HRV analysis is the ability to assess overall cardiac health and the state of the autonomic nervous system responsible for regulating cardiac activity [1], [2].
With the advent of computer based analytical tools,
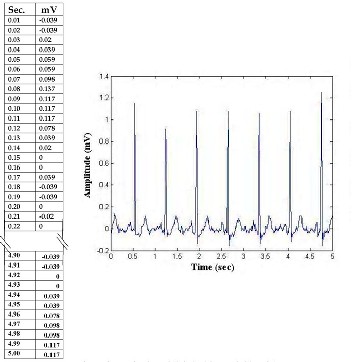
HRV signal parameters, extracted and analyzed, are highly useful in diagnostics, and as prognosis and research tools [3]. For the analysis of HRV, the common methodology is to obtain a continuous recording of Electrocardiogram (ECG) signal. ECG is the graphical recording of resultant electrical activities in relation to time; where x-axis represents the time (Sec.) and y the amplitude (mV). The digital data of y-axis is recorded in numerical form along with the time interval of x- axis. From this data, ECG tracing can be obtained by suitable graph drawing tool (Fig. 1).
IJSER © 2014 http://www.ijser.org
International Journal of Scientific & Engineering Research, Volume 5, Issue 1, January-2014 215
ISSN 2229-5518
In the present project, we measured R-R intervals by simple technique, and used for evaluation of Cardiac Electrophysiology, ANS profile etc.
Instead of a fully automated computer algorithm using complex mathematical models [7], [8]; a semi-automated interactive algorithm is utilized to determine R-R interval. (Fig. 2) A basic and preliminary understanding of ECG tracing is sufficient to use such method.
FIG. 1: TIME SERIES DATA OF DIGITAIL ECG REJCORDED (LEADSI) FOR 5 SEC. AND ER
THE ECG TRACING DRAW N BY STANDARD GRAPH DRAWING SOFTWARE (DATA
ACQUISITION RATE 100 HZ)
As for example, with a device of 1000 Hz data acquisition rate, there will be 10,000 amplitude data for a 10 second continuous ECG tracing, with a time interval of 0.001
Sec. whereas, with 100 Hz data acquisition rate, this would be
1,000 amplitude data with a time interval of 0.01 Sec.
Each ECG wave complex consists of p, q, r, s and T
wave, which repeat in a recurring pattern. Out of them, R
wave is usually the tallest and most conspicuous.
Accordingly, to assess the beat to beat interval,
detection of R to R interval (or R-R interval) is the routine and
standard practice.
There exist a number of R-R interval measurement
tools, which are incorporated within HRV analysis software [4], [5], [6]. HRV analyzing software tools that are available [7], [8]; involves pre-processing of data; filtering, detrending, smoothening, classification etc. There is application of complex QRS detection algorithm and after that, the obtained R-R interval data is used for further evaluation like Time domain, Frequency domain, Non-linear methods of analysis etc.
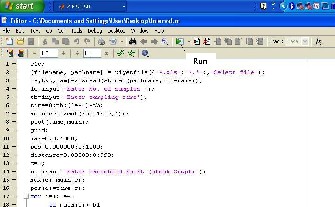
FIG.2: RUN COMMAND ON THE INSTRUCTION ALGORITHM IN THE MATLAB
PLATFORM TO DETERMINE THE R-R INTERVAL FROM THE TIME SERIES DATA OF ECG
Based on the amplitude based technique (ABT) a
simple, easy and user friendly algorithm for determination of
R-R interval is developed. ABT performs very simple comparison where the ranges of sample ECG points falling beyond an amplitude threshold are determined to be a QRS complex candidate. For Fig. 3, the amplitude threshold can be
0.4. After the QRS complex is detected, the highest amplitude
of the detected QRS is ascertained to be R peak.
After obtaining the digital data of ECG time series, we
save them in a suitable format (.exel).
We use MATLAB platform to run the designated
algorithm, that is developed in the present project (Appendix
I). The said software tool in simple, easy and interactive.
Accordingly, there are three potential problem areas. First, fully automatic detection of R-R intervals entails
the risk of error in case of low amplitude R waves, high
amplitude T wave, arrhythmia, block, ectopic beats etc.
Second, there may be loss of valuable physiological
information of health and disease during the pre-processing.
Third, an industry derived close & compact software
package system, gives hardly any scope of innovation and
independence in research.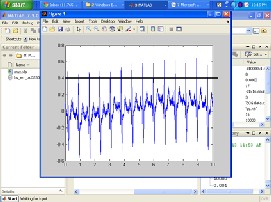
FIG. 3: PRIOR VISUALIZATION OF THE ECG TRACING AND SETTING OF THE AMPLITUDE THRESHOLD FOR DETECTION OF R PEAKS
IJSER © 2014 http://www.ijser.org
International Journal of Scientific & Engineering Research, Volume 5, Issue 1, January-2014 216
ISSN 2229-5518
The software code is opened in MATLAB, and R-R interval values are recorded, following the pre-fixed interactive protocol, as shown in the Text Box 1.
TEXT BOX 1: INSTRUCTION ALGORITHM TO DETERMINE THE R-R
INTERVAL FROM THE TIME SERIES DATA OF ECG
1 Install MATLAB package of any version to PC.
2 Obtain and Save the digital ECG data (for
determination of R-R Interval) from the Control or
Case in .xls format.
3 Open a command window of the MATLAB by clicking on the desk top icon.
4 From File menu open a new Blank M-File. Copy and paste or simply type the software code of the Appendix I on the blank space provided and save it.
5 Open the software code in MATLAB.
6 Click Run command (Fig. 2).
7 Open the digital ECG data in .xls format of step 2).
8 Record the number of sample.
9 Record the sampling time based on data acquisition
rate. With a recording device of 1000 Hz data acquisition rate, there will be 10,000 amplitude data for a 10 second continuous ECG tracing, with a
TABLE 1
MEAN AND SD OF R-R INTERVALS (MSEC) DETERMINED BY THE PROPOSED METHOD OF THE PRESENT AUTHORS AND BY THE KUBIOS SOFTWARE TOOL IN 5 NORMAL SUBJECTS
NORMAL SUBJECTS (n=5) | ||||
Sub. No | By Proposed Method | By Kubios Software | ||
Sub. No | Mean | SD | Mean | SD |
1. | 849.616 | 28.35 | 849.6164 | 28.3496 |
2. | 864.266 | 38.027 | 864.2657 | 38.027 |
3. | 728.039 | 42.448 | 728.0392 | 42.4479 |
4. | 956.27 | 84.877 | 956.2701 | 84.8770 |
5. | 797.775 | 47.588 | 797.7748 | 47.5884 |
Fig. 4 shows R-R interval series obtained by the proposed method in a normal subject and a patient with suspected autonomic neuropathy. With this raw data, R-R interval Tochograms have been generated, by using standard graph drawing software. R-R interval Tochogram is the graphical representation of R-R intervals as a function of beat number along the recording time.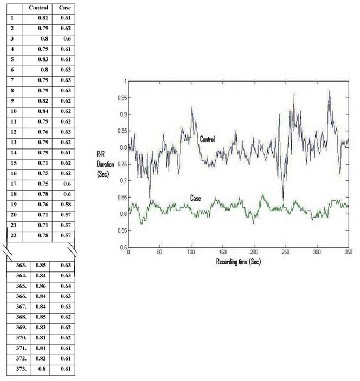
sampling time of 0.001 sec. Where, with 100 Hz
data acquisition rate, this would be 1,000 amplitude
data with a sampling time of 0.01 sec.
10 On Enter we obtain an ECG tracing (Fig. 3).
11 Record the threshold point. This is done by
examining the ECG tracing. Select amplitude
threshold point (in the present case 0.4), beyond
which the highest point is R peak (Fig. 3).
12 On giving Enter we obtain a document in excel format, having the R-R intervals.
13 Save the file of R-R intervals values in .xls format in specific drive destination.
We tasted our method in a few normal subjects and diseased patients and compared the values obtained by a popular software package (Kubios HRV tool).
Table 1 shows the Mean and SD of the R-R Intervals obtained by the proposed method and Kubios HRV tool in 5 normal subjects. They appear to be same in values in both the groups, which validate efficiency of the proposed method.
Fig. 4: A Series of R-R intervals (Sec.) and R-R interval Tochogram in a control subject and a case of suspected autonomic neuropathy, recorded for 6 minutes
IJSER © 2014 http://www.ijser.org
International Journal of Scientific & Engineering Research, Volume 5, Issue 1, January-2014 217
ISSN 2229-5518
The present method provides the acquisition of detail data of each R-R interval, during a course of recording of ECG. By prior visualization of the ECG tracing, the threshold of recording amplitude is determined, and the peak sample ECG points above the said amplitude threshold is considered as R- R peak. The distance between consecutive R waves are the beat-time interval or R-R interval. With this simple technique, the R-R intervals that are serially determined can be utilized to measure a large number of electrophysiological parameters of cardiovascular system and autonomic nervous system.
As for example the R-R interval tochogram is
constructed with the acquired data from a normal control and
a suspected case of autonomic neuropathy (Fig. 4). This simple
representation clearly separates the control from the case. There is evidence of decreased variability of R-R intervals in the case. There may be many such innovative way of representation of physiological variation in health and in disease state.
It has been observed that, the conventional, fully automated R-R detection algorithm sometimes fails to exclude the high amplitude variation of the T-waves and counting them as R waves. These leaves to error in the very outset of this highly sensitive evaluation process (1).
[1] U.R. Acharya, K.P. Joseph, N. Kannathal, C.M. Lim, J.S. Suri, “Heart rate variability: a review,” Med Bio Eng Comput 2006; 44: 1031–1051.
[2] M. Malik “Heart rate variability. Standards of
measurement, physiological interpretation, and clinical use-Task Force of the European Society of Cardiology and the North American Society of Pacing and Electrophysiology,” European Heart Journal 1996;
17: 354-381.
[3] J.F. Thayer, F. Åhs, M. Fredrikson, J.J. Sollers, T.D.
Wager, “A meta-analysis of heart rate variability and
neuroimaging studies: Implications for heart rate variability as a marker of stress and health,” Neuroscience and Biobehavioral Reviews 2012; 36: 747–
756.
[4] G.M. Friesen, T.C. Jannett, M.A. Jadallah, S.L. Yates,
S.R. Quint, H.T.Nagle, “A comparison of the noise sensitivity of nine QRS detection algorithms,” IEEE Trans Biomed Eng, 1990; 37(1):85–98.
[5] P.S. Hamilton, W.J. Tompkins, “Quantitative
IJSER
As the available software tools for HRV are industry
derived, they are closed and compact system, provides automatic output in the form of interpreted results. As for example, instead of providing detail R-R interval time series, the software package output gives the final results of varies parameters. So, there is hardly any scope of innovation and research, other than reproduction of the conventional parameters (Time domain, Frequency domain, Non-linear methods etc). A number of novel mathematical modeling and also evaluation of various correlation dimensions can also be done with respect to various physiological variations and disease states. Thus the acquisition of R-R interval data series is essentially required for these purposes, which the commonly available software tools do not provide.
In the present project, the development of this simple,
user friendly tool may serve the purpose.
investigation of QRS detection rules using the
MIT/BIH arrhythmia database,” IEEE Trans Biomed
Eng 1986; 33(12):1157–1165.
[6] O. Pahlm, L. S¨ornmo, “Software QRS detection in ambulatory monitoring – a review, Med Biol Eng Comput 1984; 22:289–297.
[7] M.P. Tarvainen, S.D. Georgiadis, P.O. Ranta-aho and P.A. Karjalainen, “Time-varying analysis of heart rate variability signals with Kalman smoother algorithm,” Physiol Meas 2006; 27(3):225–239.
[8] V.X. Afonso, “ECG QRS detection,” In: Tompkins WJ,
ed. Biomedical Digital Signal Processing. New Jersey, Prentice Hall 1993: 237–264.
IJSER © 2014 http://www.ijser.org
International Journal of Scientific & Engineering Research, Volume 5, Issue 1, January-2014 218
ISSN 2229-5518
TEXT BOX 2: R-R detection algorithm clc;
[filename, pathname] = uigetfile({'*.xls';'*.*'},'Select file'); [A,txt,raw]=xlsread(strcat(pathname,filename)); le=input('Enter No. of samples ');
tb=input('Enter sampling time');
time=0:tb:(le-1)*tb;
main=cell2mat(raw(1:le,1));
plot(time,main); grid; max=0:0:1000;
pos=0.000000:0:1000; distance=0.00000:0:999; c=1;
bl=input('Enter threshold point (check Graph)');
max(c)=main(c);
pos(c)=time(c);
for i=1:le-1
if main(i)>=bl
if max(c)< main(i) max(c)=main(i); pos(c)=time(i);
end
if (main(i+1)<=bl);
c=c+1; max(c)=-1000; pos(c)=-1000;
end end
end
d=le+1; max(c)=0; pos(c)=0; c=c-1;
for i=1:c-1
IJSER
distance(i)=pos(i+1)-pos(i);
end
distance
[fn,pn]=uiputfile('*.xls','Give a Name');
fileID = fopen([pn,fn],'w');
fprintf(fileID,'%5f\t\n ',distance);
fclose(fileID);
Abhilash Sengupta, postgraduate student,
Dept. of Electronics & Communication, Birla Institute of Technology, Mesra, Ranchi, India.
Soma Roy, postgraduate student
Dept. of Physiology, Calcutta Medical College, Kolkata, India
Arnab Sengupta, Professor,
Dept. of Physiology, Calcutta Medical College, Kolkata, India. Email: arnabseng@gmail.com
IJSER © 2014 http://www.ijser.org