provided using optimization techniques with simulation
Where
International Journal of Scientific & Engineering Research, Volume 4, Issue 6, June-2013 1707
ISSN 2229-5518
Optical Transmission System Simulation for
Analysis of Self Phase Modulation Non Linearity
Monica Bhutani, Abhishek Gagneja
Abstract – Non linear effects (NLE) are just a consequence of increasing need for high data rates, number of wavelengths, transmission lengths and optical power levels. They appear when the response of a system or process is not proportional to the stimulus given to it. Fiber nonlinearities came into picture in around 1970’s. They were ignored then, but were feared during 1990s with the development of LASERS. Reason behind NLE is ultra fast third order susceptibility whose real part contributes to self phase modulation (SPM), cross phase modulation (XPM) and four wave mixing (FW M) and imaginary leads to Stimulated Brillioun Scattering (SBS) and Stimulated Raman Scattering (SRS). Optical fibers, now a days have proved to be an unbeatable medium for designing and manipulating applications like light amplification, optical signal processing, optical switching, etc. Earlier we faced issues like optical attenuation and dispersion in fibers, which can now be easily dealt with using a variety of avoidance and cancellation techniques, but nonlinearities like SPM, XPM and FW M need special attention while designing a fiber optic transmission system (FOTS). Here we investigate effects of power, bit rate, dispersion, fiber length and laser frequency on simulation of optical communication system with SPM using parametric run feature in Optsim. Increased input power affects the system as it makes SPM grow which eventually depletes the signal. SPM occurs in signal channel configurations, where it basically converts optical power fluctuations into phase fluctuations in the same wave.
Index Terms – Non Linear effects (NLE), Self Phase Modulation (SPM), Cross Phase Modulation (XPM), Four Wave Mixing (FWM), Wavelength Division Multiplexing (W DM), Stimulated Raman Scattering (SRS), Stimulated Brillouin Scattering (SBS), Optsim
—————————— ——————————
n optical fiber communication systems, we send information from one place to another in the form of light pulses. The requirements such as high data rate and large number of transmission channels have made today’s fiber
optic data systems very complex, expensive and lossy. Spectral broadening in FOTS is omnipresent regardless of the amount of optical power transmitted. But non-linear effect come into picture when requirements like high data rates, transmission lengths, number of wavelengths and optical power level increases. Fiber non-linearity includes Stimulated Brillouin scattering (SBS), Stimulated Raman Scattering (SRS), Four wave mixing (FWM), self phase modulation (SPM) and cross phase modulation (XPM). If the input optical power increases after certain threshold level, it contributes to intensity of special broadening exponentially. Fundamental difference between SBS and SRS comes with the participating phonons. There are optical phonons in SRS while SBS deals with acoustic phonons. Another fact which makes them differ is direction of occurrence. SBS occurs in backward direction only while SRS in both; forward and backward.
An optical field modifies its own phase under SPM whereas under XPM an optical pulse changes not only its own phase but also of other co-propagating beams. Though SPM
————————————————
• Monica Bhutani is currently working as an Assistant Professor with Bharati Vidyapeeth College of Engineering, New Delhi under GGSIP University. E-mail: shiny.mona@gmail.com
• Abhishek Gagneja is currently working as an Assistant Professor with
Bharati Vidyapeeth College of Engineering, New Delhi under GGSIP
broadens and degrades the performance of a light wave system but on a positive note, it increases optical switching speed. SBS can be controlled by XPM by launching a pseudo random pulse of a different frequency. Otherwise fiber Bragg gratings can suppress SBS. Though XPM leads to inter-channel cross talk in systems employing WDM but can be beneficial for wavelength conversion and pulse compression. FWM also degrades system performance by generating additional noise but can be used for parametric amplification (amplify a weak signal) and pulse conjugation in optical systems.
Now, Kerr effect basically manifests three important non- linear effects; SPM, XPM and FWM. Out of these three only FWM can contribute to gain to one channel at the cost of reducing power from other channels. Both SPM and XPM produce a phase shift in the pulse, broaden the spectrum and increases overall dispersion.
SDM occurs in single channel system where as FWM and XPM are more prevalent in WDM and DWDM systems which carry a number of wavelengths XPM matches with SPM as it also broadens the spectrum, but here total phase shift on a channel is calculated which is the effect of total power variations on all channels. Here one channel can change the phase of another channel via optical Kerr effect. XPM can be beneficial in some cases as it can be used as a mechanism to convert wavelength of a channel. This paper studies the impact of SPM non-linearity on RZ and NRZ modulation formats.
Self phase modulation in an optical system is said to occur when the phase of a beam is modulated non- linearly by its
University.E-mail: agagneja04@gmail.com
IJSER © 2013 http://www.ijser.org
International Journal of Scientific & Engineering Research, Volume 4, Issue 6, June-2013 1708
ISSN 2229-5518
own intensity. The portions of beam which carry high intensity have high refractive index compared to those having low intensities.
The refractive index of core in an optical fiber is given by equation (optical Kerr effect)
𝑃
Optimization and simulation consulting (optsim) is a software tool for designing and simulating optical fiber systems. It has easy to use graphical user interface (GUI) and gives a lab like experience when we talk of measuring instruments. Here fully customized solutions can be
provided using optimization techniques with simulation
Where![]()
𝑛 = 𝑛0 + 𝑛2 ∗
𝑒𝑓𝑓
(1)
modeling. The tool accurately visualizes, evaluated and reduces the complexity and risks associated with the system significantly. We have used version 5.1 for our
n0 = linear refractive index of core n2 = non linear refractive index
P = optical power (in Watts)
Aeff = effective area of core
Due to the factor n2, a phase shift is produced, which is in proposition to the intensity of pulse. Further due to non- uniformity in the power along the pulse, there in non uniform distribution of intensity in spectral components.
This phase shift changes the central frequency of the pulse and the difference is called frequency chirp. As phase fluctuations are intensity dependent, there is different phase shift in the different parts of the fiber. Hence SPM broadens the optical spectrum non-linearly.
As chirping phenomenon increases with increase in input power, SPM grows at high power levels. Furthermore, nowadays EDFA’s are employed to counter attack attenuations and amplify the signal, which increases optical power level and hence contribute to SPM. As can be seen from equation (1), the significance of SPM can be reduced by operating the systems at low power levels and by increasing the effective fiber core area. Here, EDFA noise has not been taken into consideration for the ease of analysis.
According to optical Kerr effect:
𝑛(𝐼) = 𝑛0 + 𝑛2 (𝐼) (2)
Where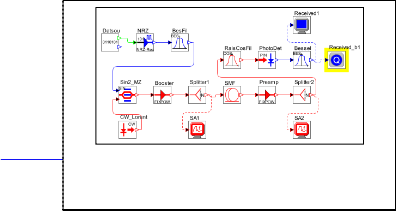
n(I) = intensity dependent change in refractive index n0 = linear refractive index
n2(I) = non linear refractive index (intensity dependent)
As refractive index of fiber core is now power dependent, it affects chromatic dispersion in the fiber, which changes the pulse broadening rate throughout the fiber.
simulation with ease of use on windows as well as UNIX
platforms.
This feature allows us to simulate a particular parameter with different numerical values. We gave values in a table and then simulation starts and sweeps all those values. For this, the parameter is first defined in global symbol window and then it is used in component parameter window. Some initial value needs to be assigned to the parameter in scan setup window, which can be updated and modified thereafter. Optsim simulates on multiple values automatically and reduces processing time also. After run feature, we get to see various results of same parameter with different numerical values. Individual output can be seen or many can be made to overlap. In this paper we have used parametric run six times for six different parameters and all of them were given different numerical values.
TABLE 1
PARAMETERS USED FOR VARIATION
Parameters (Unit) | Numerical Values |
Length of fiber (km) | 20, 25, 30, 35 |
Bit Rate (Gbps) | 10, 15 |
Center Emission Frequency (THz) | 193.0, 193.02, 193.04 |
Preamplifier Power (mW) | 10, 20 |
Dispersion(ps/nm/km) | -5, 10 |
Booster Power (mw) | 10, 13, 17 |
The simulation setup for SPM configuration is shown in Fig
1. For simplicity, the block diagram of the complete system has been split into three sections, i.e. transmitter section, channel and receiver section.
IJSER © 2013 http://www.ijser.o
Fig 1. This simulation will help us to observe the effects of SPM on a fiber optic system with parametric run feature on various components.
International Journal of Scientific & Engineering Research, Volume 4, Issue 6, June-2013 1709
ISSN 2229-5518
Very first block in this section is Data source or a pseudo random signal generator. Here data rate and baud rate (bits/symbol) can be customized.
Next is the electrical driver to convert binary sequence into electrical pulses. Several mapping techniques can be employed such as rectangular (NRZ, RZ), raised cosine (NRZ, RZ) etc. out of which we have chosen rectangular NRZ and rectangular RZ. Bessel or “Maximally flat delay” filters are implemented numerically via IIR (Infinite Impulse Response). Here we have employed band pass Bessel electrical filter in transmitter as well as in the receiver section. Minimum value for center frequency (GHz) is zero and maximum is Bo=VBS/4. To plot filter transfer function, amplitude plots are required. Then there is continuous wave (CW) Lorentzian laser with various values of power coming out of it; [CW power (dBm or mW)]. Relaxation oscillator’s peak overshoot sets overshoot of phase noise where as its resonant frequency is set by relaxation oscillation peak frequency. Thermal effects have not been taken into account. Booster is nothing but a fixed output power optical amplifier which stimulates an EDFA (Erbium Doped Fiber Amplifier). Here various values for output power can be assigned in which internally generated ASE noise is also taken into account. Further “No Noise” feature can be selected for comparison with ideal case. Doped fiber length is the length of erbium doped fiber in meters. On the other hand fixed gain Amplifiers are employed where main focus is on fiber transmission properties and not on amplification issues. Then there is first measuring component i.e. optical spectrum analyzer. It estimates the input spectrum by partitioning the total data sequence into various sections each having NP samples where NP is the number of spectrum points over the simulation bandwidth.
Channel basically consists of two components: optical fiber and in line amplifier. We can have a combination of these two intrinsically periodic components via iteration loop feature. To observe Kerr effects, fiber non-linearity switch should be made ‘ON’. Fiber SBS switch turns on/off the steady state Brillouin Scattering effects. We have simulated our system on various lengths of pre-defined standard SM fiber.
Receiver section starts with a fixed EDFA as preamplifier. This model implements a raised cosine optical filter, where main concern is on center frequency and pass band; not on
shape of filter. In between pre amplifier and optical filter there is optical spectrum analyzer to access the non-linear output optical spectrum.
Next component simulates a photodiode. PIN and APD are two choices, out of which PIN is employed in concerned model. Dark current- shot noise and quantum noise have been taken into account. Photodiode basically does optical to electrical conversion.
Here ends the model. Further two processing components i.e. electrical scope and quantum estimator employed which actually do not take part in the simulation. Scope is a visualization tool that collects data on various diagrams such as eye diagrams, electrical signal amplitude, histogram and power spectrum. Eye diagrams can be used to effectively analyze the performance of a system. Wide eye opening justifies less crosstalk and vice versa.
Quantum estimator estimates quality of received electrical signal. Q factor is calculated using mean and standard deviation of samples considering optimum threshold. Q value is the value that maximizes quality at optimum sampling instant.
By parametric variation, the following results have been obtained.
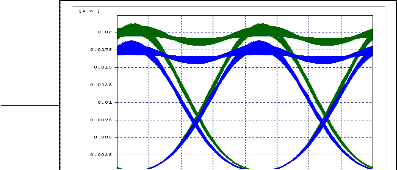
Optical signal is one of the most fundamental and complex components of OPTSIM. Via parametric run feature, length of fiber is varied from 20-35k with an increment of 5 km.
Fig 2. Input to the model which is common to all results. Input power is 10mW .
IJSER © 2013 http://www.ijser.
International Journal of Scientific & Engineering Research, Volume 4, Issue 6, June-2013 1710
ISSN 2229-5518
As length of fiber increases, the power level decreases because of increase in the attenuation level. Output power level goes down from 10.406dBm to 9.790dBm. The reference frequency is taken as 193.415THz. Fiber non linearity coefficient was taken as 1.8 A/V/km and non linearity refractive index is 3x10²⁰. Core refractive area is
67.5m2. Further we see that eye opening decreases with
increase in transmitted power. If we compare the two signals eye closure increases from 0.2199dB to 0.2520dB and quality factor decreases from 38.72dB to 30.95dB.
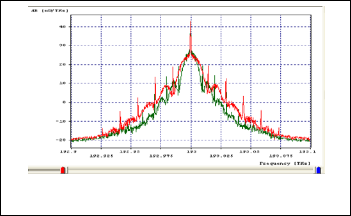
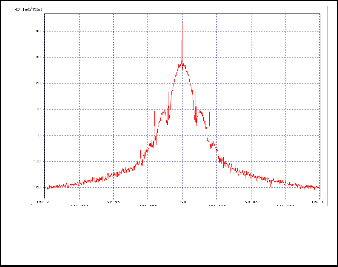
Figure 3 shows a comparative simulation of 2 different data rates i.e. 10GBps and 15gbps.
Spectral broadening is very much visible and hence is the signal degradation. Here 25 samples have been taken per bit and synchronization signal type taken is ‘pulse’. Conclusion is that more bit rate means transmitting more symbols which eventually contributes more to cross talk and interference.
Figure 6 shows output optical spectrum corresponding to a set of 3 emission frequencies overlapping as 193 THz,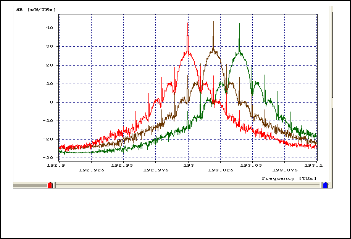
193.02 THz and 193.04 THz.
Fig 4. Comparative simulation of 2 different data rates.
Fig 6. Output optical spectrum corresponding to a set of 3 emission frequencies overlapping as 193 THz, 193.02 THz and 193.04 THz
Baud rate is 10Gbaud/s for 10 Gbps. From figure we see that as bit rate increases spectrum broadens. Further quality factor (Q) decreases from 29.73dB to 29.04dB. Eye closure increases from 0.2614dB to 0.2746dB whereas vice versa happens with eye opening as it goes down from 0.0155dB to 0.0153dB. Further if we compare input and output spectrum for bit rate 20Gbps we get Figure 5.
Emission frequency is basically the center frequency of continuous wave laser we have employed. Laser phase noise is taken into account by generating a Lorentzian emission line shape whose FWHM is pre-specified. As we increase the center frequency Q value decreases; eye closure increases and eye opening decreases. Further output power decreases with increase in emission frequency which
depletes the signal and displaces the side bands.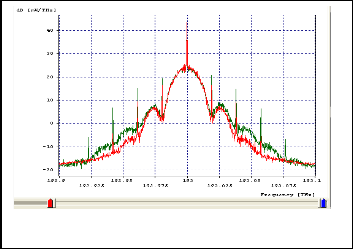
TABLE 2
EFFECT OF FREQUENCY VARIATION
Parameter under observation | Frequency | ||
Parameter under observation | 193 THz | 193.02 THz | 193.04 THz |
Q value (in dB) | 26.929 | 26.808 | 26.73 |
Eye closure (in dB) | 0.4847 | 0.494 | 0.558 |
Eye opening (in dB) | 0.273x10⁻² | 0.2573x10⁻² | 0.238x10⁻² |
Output power (in dBm) | 9.942 | 9.696 | 9.373 |
Fig 5. Input and output spectrums at 20Gbps
IJSER © 2013 http://www.ijser.org
International Journal of Scientific & Engineering Research, Volume 4, Issue 6, June-2013 1711
ISSN 2229-5518
Figure 7 represents output spectrum analysis for preamplifier powers of 10mW and 20mW with ‘flat’ gain shape as we see output power decreases with increase in input transmitted power.
Input power is taken as 11dBm. With increase in dispersion, Q factor decreases. It also has adverse effect on eye opening. Output power also decreases with increase in dispersion.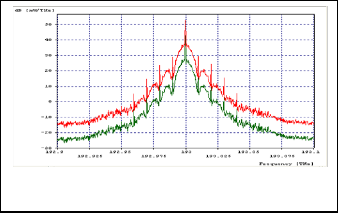
TABLE 4
EFFECT OF DISPERSION VARIATION
Fig 7. Output spectrum analysis for preamplifier powers of 10mW
and 20mW
Gain saturation and operating point of EDFA is evaluated using the estimate of input power spectrum. Q value increases as preamplifier power increases while it also improves eye opening.
TABLE 3
EFFECT OF PREAMPLIFIER VARIATION
2nd, 3rd, 4th and 5th order coefficients have been taken into account. In addition, a random variation of 2nd order variation is considered by using two statistical distributions and a predefined correlation length.
Figure 9 represents spectrum corresponding to input powers 10mW, 13mW and 17mW. Input amplifier is named as booster which is a fixed output power model which
takes into account ASE noise.
Figure 8 shows spectrum analysis for two different values of dispersion i.e. -5ps/nm/km and +10ps/nm/km. Reference frequency for dispersion is taken as 193.414 THz and corresponding wavelength is 1550nm.
Fig 9. Spectrum corresponding to input powers 10mW, 13mW and
17mW
By increasing the input power, SPM grows and eventually depletes the signal. On the other hand output measured power decreases with increase in booster power. The eye diagram also highlights PM to AM alteration due to self phase modulation. Specifically, eye opening decreases with increase in transmitted power. Input power is in direct
proportion with SPM.
Fig 8. Spectrum analysis for two different values of dispersion i.e. -
5ps/nm/km and +10ps/nm/km
TABLE 5
EFFECT OF INPUT POWER VARIATION
Q value (in dB) 32.04 30.31 7.31
Eye closure (in dB) 0.2732 0.428 17.22
Eye opening (in dB) 0.357x10⁻² 0.256x10⁻² 0.121x10⁻⁴
Output power 9.878 9.415 8.919
International Journal of Scientific & Engineering Research, Volume 4, Issue 6, June-2013 1712
ISSN 2229-5518
TABLE 7
EFFECT OF USING RZ FORMAT
Mainly conventional NRZ modulation formats were being employed in optical communication systems because of generation ease, less cost and less bandwidth. In our model we have employed RZ as well as NRZ modulation schemes. In either of the methods, the signal alternates between a positive and negative value of voltage. Logic 1 is for +V and logic 0 is for –V. In NRZ scheme, logic) and Logic 1 transitions directly crosses the neutral voltage level whereas transitions stay temporarily in 0 level in RZ scheme. But as in optics, there is no phenomenon like negative light, so in that context, NRZ means a pulse of light for logic 1 and no light for logic zero. Conversely, in RZ the pulse of light is narrower than the bit period. Figure
9 shows output spectrum again for 3 different frequencies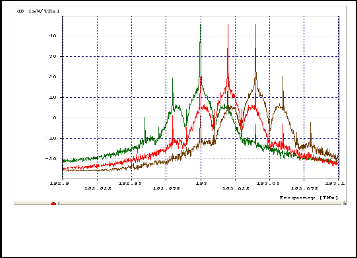
but with RZ rectangular modulator driver. It is observed that Q factor is significantly improved by use of RZ signals.
Fig 9. Output spectrum again for 3 different frequencies but with same modulator driver (RZ)
TABLE 6
EFFECT OF USING NRZ FORMAT
The behavior of SPM for different lengths of fiber, bit rates, center emission frequencies, dispersions and booster powers has been investigated in this paper. The parameters are varied with the help of the parametric run feature in Optsim. The following observations have been made
a. Increasing the length of the fiber causes a decrease in the Q factor.
b. Increasing Bit rate causes spectral broadening and thus
degrades the signal quality.
c. When the preamplifier power is varied, Q factor is found to increase slightly and the eye closure happens to decrease. It is worth noting here that if the input power is increased, the preamplifier power is found to decrease.
d. Increasing dispersion value drastically degrades the Q
factor value.
e. Increasing input power up to some extent causes some degradation which increases considerably if the input power is further increased.
f. Use of RZ signals is found to give better results than
NRZ signals.
[1] Amemeya M. et al., “Pulse Broadening due to higher order dispersion and transmission limit”, Journal of Lightwave teschnology, vol. 20, no.
4pp 591-597, April 2002.
[2] Pinault S. C. and Potasek M. J., “Frequency broadening by self – phase modulation in optical fibers”, Journal of optical society of America, B, vol.
2, no. 8, pp 1318-1319
[3] Agrawal, G. P., “Self Phase modulation and spectral broadening of optical pulses in semiconductor laser amplifiers , vol. 25, issue 11, IEEE pp 2297-
2306
[4] G. C. Baldwin “Introduction to non-linear optics”, Plenum Press, New
York, 1969
[5] Stolen R H, ”Self phase modulation in silica optical fibers”, C Lin –
physical review A, 1978- Abs
[6] V Bobrovs, G Ivanous, J Porins, “Influence of non-linear optical effects on the NRZ and RZ modulation signals in WDM systems,” Electronics and
13
International Journal of Scientific & Engineering Research, Volume 4, Issue 6, June-2013 1713
ISSN 2229-5518
Electrical Engineering 2007- internet.ktu.it
[7] G. P. Agrawal, “Fiber-optic communication system, 3rd ed., Wiley, New
York, 2002”
[8] R. Chraplvvy, “Limitations on light-wave communications imposed by optical fiber non-linearities, “Journal of Light-wave technology, vol. 8, pp.
1548-1557, 1990
[9] Supe, J. Porins, “Methods for estimation of optical fiber nonlinearities using self phase modulation effect”, Institute of Telecommunication, Riga Technical University, 12 Azenes Str, LV-1048, N6, 2011
[10] B. Tiwari, V. Prakash, V. Tripathi, N. Malaviya, “Nonlinear effects in
optical fiber transmission system”, IETE Tech., Rev. 16 (1999), 461-479.
IJSER © 2013 http://www.ijser.org

